
Why This Ranking Matters
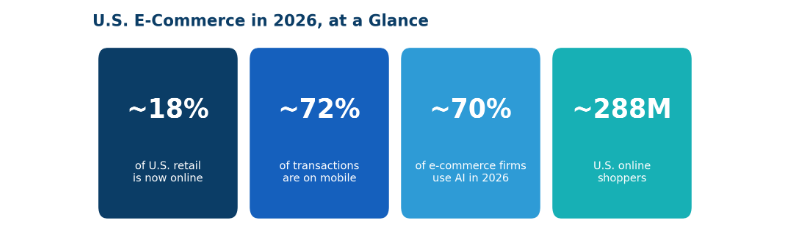
American e-commerce has crossed a threshold where being big is no longer the same as being safe. The U.S. online retail market is approaching $1.3 trillion in 2026 on a Census-based measure — with broader forecasts from eMarketer running as high as $1.6 trillion depending on which categories are counted — and it continues to grow at roughly 8–10% a year, several times faster than total retail’s ~3%. Online now accounts for close to 18% of all U.S. retail spending, and the number of American online shoppers is on track to reach roughly 288 million this year.
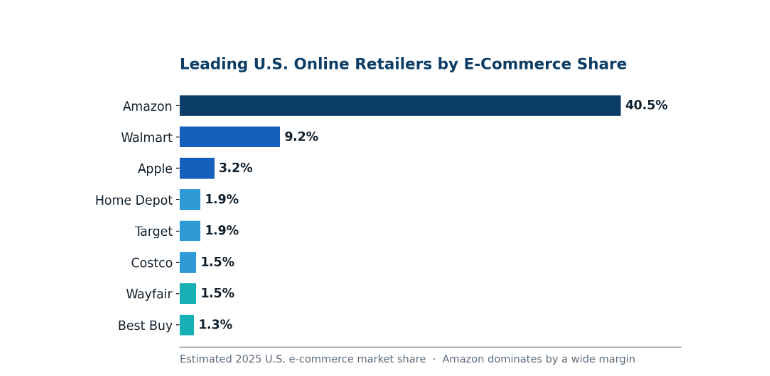
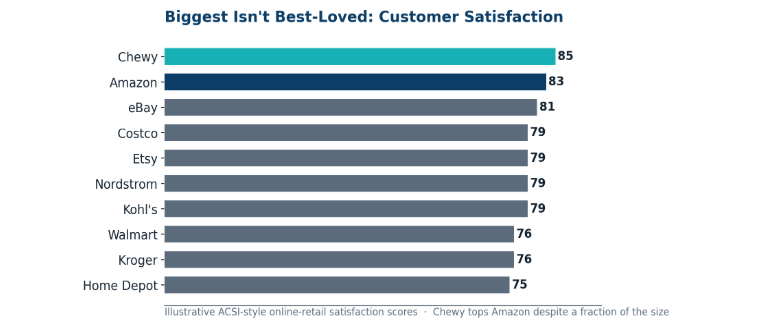
But underneath those headline numbers, the ground is shifting. Amazon still captures about 40% of every U.S. e-commerce dollar, yet it no longer leads on customer satisfaction. Smaller, more focused players are quietly out-earning their market share by turning service into a moat. Decades of American Customer Satisfaction Index research show satisfaction predicting long-term revenue and stock performance — which means a company posting record sales while customers quietly defect is carrying hidden risk, not durable strength.
That is the lens for this ranking. We didn’t just count revenue. We evaluated the top 30 U.S. e-commerce companies across six weighted business criteria — including customer experience and support quality — because in 2026, how a brand treats its customers after “buy now” is what separates the leaders from the merely large.
What you’ll learn: how the market is sized and changing; the six-factor methodology behind our ranking; full profiles of all 30 companies with CX, innovation, and support insight; side-by-side comparisons; the patterns the best brands share; the CX trends reshaping retail; and how leading brands actually scale support to keep up.
Our Ranking Methodology
Most “top e-commerce companies” lists rank by a single number — usually revenue or web traffic. That tells you who is biggest, not who is best, and it certainly doesn’t tell you who is positioned to win the next five years. We built a weighted, six-factor model instead. Each company received a 100-point composite score, and that score set its rank.
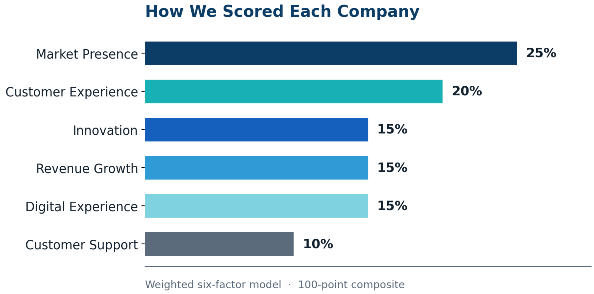
Customer experience and support account for 30% of our scoring model, making e-commerce customer service KPIs and metrics an important consideration when evaluating digital retail performance. ACSI research consistently shows satisfaction and seller profitability moving together over time; when they diverge, it tends to signal trouble ahead rather than a bargain. Building CX into the score rewards the retailers most likely to compound their advantage.
A note on the data: Revenue and share figures reflect the latest reported fiscal-year data and reputable third-party estimates (eMarketer, Statista, the U.S. Census Bureau, and ACSI). Composite scores are directional by design — treat the ranks as a map of market leadership and customer love, not a decimal-precise league table.
U.S. eCommerce in 2026: An Industry Snapshot
Before the rankings, some context on the market these companies compete in — because the forces below shaped every profile that follows.
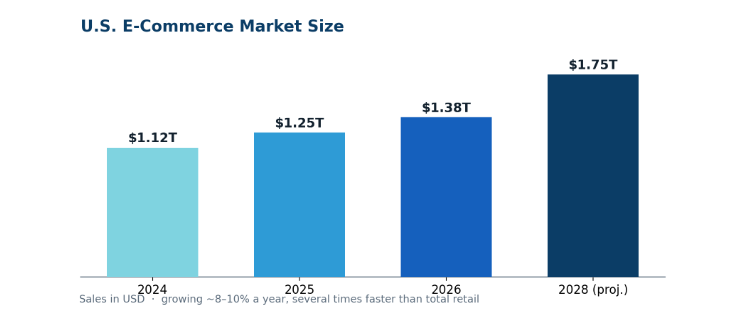
The market is huge and still expanding: U.S. online sales are nearing $1.3 trillion and forecast to keep growing at high-single to low-double digits through the decade, taking share from physical retail every quarter.
Mobile is the default, not the alternative: Smartphones account for roughly 72% of U.S. e-commerce transactions. Most retailers have solved mobile traffic, but not mobile conversion — and that gap is where revenue leaks.
AI has moved from pilot to plumbing: An estimated 70% of e-commerce companies use AI for personalization, forecasting, and fraud prevention, and AI shopping assistants are projected to influence roughly $20 billion in U.S. sales this year.
Consumer expectations keep ratcheting up: Shoppers now expect same-day delivery, frictionless returns, real-time tracking, and support on any channel. Baymard research suggests checkout fixes alone could lift conversion by more than 35%.
Returns are a structural cost: Online return rates run far higher than in-store, making reverse logistics and returns support a major operational line item — especially in apparel, furniture, and electronics.
Omnichannel is the expectation: BOPIS, curbside, ship-from-store, and app loyalty are table stakes. The retailers winning share are erasing the seam between digital and physical.
The Top 30 U.S. eCommerce Companies (2026)
The full ranking at a glance, followed by a consistent profile for every company: overview, key facts, market position, CX strengths, innovation, support model, and why it ranks where it does.
|
# |
Company |
Primary Category |
SkyCom Score |
|
1 |
Amazon |
Everything — electronics, home, apparel, grocery, media, cloud |
98 / 100 |
|
2 |
Walmart |
Grocery, general merchandise, apparel, home |
94 / 100 |
|
3 |
Apple |
Consumer electronics, accessories, digital services |
91 / 100 |
|
4 |
Costco |
Bulk grocery, electronics, home, seasonal, pharmacy |
87 / 100 |
|
5 |
The Home Depot |
Home improvement, building materials, tools, appliances |
85 / 100 |
|
6 |
Chewy |
Pet food, supplies, pharmacy, wellness |
84 / 100 |
|
7 |
eBay |
Collectibles, refurbished electronics, auto parts, fashion |
82 / 100 |
|
8 |
Target |
General merchandise, apparel, home, beauty, grocery |
81 / 100 |
|
9 |
Best Buy |
Consumer electronics, appliances, gaming, services |
79 / 100 |
|
10 |
Kroger |
Grocery, pharmacy, fuel, private label |
78 / 100 |
|
11 |
Lowe’s |
Home improvement, appliances, outdoor, pro supply |
76 / 100 |
|
12 |
Wayfair |
Furniture, décor, home goods |
74 / 100 |
|
13 |
Macy’s |
Apparel, beauty, home, accessories |
73 / 100 |
|
14 |
Nordstrom |
Premium apparel, footwear, beauty, accessories |
72 / 100 |
|
15 |
Kohl’s |
Apparel, home, beauty (Sephora shops) |
70 / 100 |
|
16 |
Etsy |
Handmade, vintage, personalized, craft |
69 / 100 |
|
17 |
Gap Inc. |
Apparel (Old Navy, Gap, Banana Republic, Athleta) |
68 / 100 |
|
18 |
Williams-Sonoma |
Kitchen, furniture, décor (Pottery Barn, West Elm) |
66 / 100 |
|
19 |
Qurate Retail (QVC & HSN) |
Apparel, beauty, home, electronics via live shopping |
65 / 100 |
|
20 |
Ulta Beauty |
Cosmetics, skincare, fragrance, salon services |
64 / 100 |
|
21 |
Nike |
Athletic footwear, apparel, equipment |
63 / 100 |
|
22 |
Dick’s Sporting Goods |
Sporting goods, athletic apparel, outdoor |
62 / 100 |
|
23 |
Sam’s Club |
Bulk grocery, general merchandise, tech |
61 / 100 |
|
24 |
Albertsons |
Grocery, pharmacy, fuel |
60 / 100 |
|
25 |
TJX Companies |
Off-price apparel, home (T.J. Maxx, Marshalls, HomeGoods) |
59 / 100 |
|
26 |
Dell Technologies |
PCs, servers, peripherals, enterprise hardware |
58 / 100 |
|
27 |
Petco |
Pet food, supplies, vet services, grooming |
57 / 100 |
|
28 |
Instacart (Maplebear) |
Grocery delivery marketplace, retail media |
56 / 100 |
|
29 |
Carvana |
Used vehicles, financing, trade-ins |
55 / 100 |
|
30 |
Beyond (Overstock / Bed Bath & Beyond) |
Home goods, furniture, décor |
53 / 100 |
1. Amazon — Score 98/100
HQ: Seattle, WA Founded: 1994 Revenue: ~$638B total; ~40% U.S. e-commerce share
Market position: The undisputed leader, capturing roughly two of every five U.S. e-commerce dollars. No competitor is within striking distance on scale.
Customer experience: Amazon set the modern CX bar — one-click checkout, Prime shipping, effortless returns — and still earns a strong ACSI satisfaction score near 83, though the sheer breadth of its catalog now creates friction focused rivals avoid.
Innovation: Same-day and next-day Prime delivery, Alexa voice commerce, AWS-powered personalization, and a third-party marketplace larger than most standalone retailers.
Support model: Massive blended infrastructure — deep self-service tooling backed by scaled contact centers and industry-defining returns logistics.
Why it ranks here: Unmatched market presence, strong CX, and relentless innovation. Amazon is the benchmark every other company here is measured against.
2. Walmart — Score 94/100
HQ: Bentonville, AR Founded: 1962 Revenue: ~$681B total; ~9% U.S. e-commerce share
Market position: The clear #2 online and the fastest-climbing traditional retailer of the past five years — now leading Amazon in grocery e-commerce share.
Customer experience: Steadily improving, with its ACSI score rising to around 76 on the back of remodeled stores, expanded pickup, and faster delivery. Walmart+ deepens loyalty against Prime.
Innovation: A best-in-class omnichannel playbook (curbside and pickup at scale), plus Walmart Connect, one of the fastest-growing retail media networks in the country.
Support model: A blend of in-house teams and BPO partnerships to absorb peak-season spikes without quality drops.
Why it ranks here: Enormous scale plus genuine year-over-year CX and digital gains — a rare combination at this size.
3. Apple — Score 91/100
HQ: Cupertino, CA Founded: 1976 Revenue: ~$391B total; ~3% U.S. e-commerce share
Market position: The third-largest U.S. online retailer by share, and arguably the most profitable digital storefront per visit.
Customer experience: Famously seamless. The online store, retail stores, and support ecosystem feel like one continuous experience, and Apple consistently earns elite satisfaction and loyalty scores.
Innovation: Configure-to-order, trade-in and upgrade programs, AR product previews, and a services layer (iCloud, AppleCare) that turns hardware buyers into recurring-revenue customers.
Support model: Genius Bar, chat, and phone support tightly integrated with product ecosystems — a gold standard for premium tech support.
Why it ranks here: Elite CX and digital experience offset a narrower catalog. Apple proves focus and polish can rival breadth.
4. Costco — Score 87/100
HQ: Issaquah, WA Founded: 1983 Revenue: ~$254B total
Market position: A modest online share but outsized influence, powered by a membership model with 90%+ renewal rates.
Customer experience: Trust is the product. A generous return policy and curated “treasure hunt” assortment drive an ACSI score near 79 and loyalty that promotions can’t buy.
Innovation: Membership-driven e-commerce, same-day grocery via partners, and disciplined SKU curation that keeps average order values high.
Support model: Straightforward, member-first service backed by an ironclad satisfaction guarantee.
Why it ranks here: Loyalty and CX punch far above its raw digital share.
5. The Home Depot — Score 85/100
HQ: Atlanta, GA Founded: 1978 Revenue: ~$152B total
Market position: The dominant home-improvement e-commerce brand, with pro contractors driving disproportionate online spend.
Customer experience: Improving satisfaction (ACSI near 75), helped by same-day delivery partnerships and a mobile app that integrates inventory checks, project planning, and B2B credit.
Innovation: Deep digital-physical integration and pro-focused B2B tools few competitors match.
Support model: Consistent service across web, app, and warehouse — built as a complement to stores, not a replacement.
Why it ranks here: Category leadership plus a genuinely integrated omnichannel model.
6. Chewy — Score 84/100
HQ: Plantation, FL Founded: 2011 Revenue: ~$11.9B total
Market position: The pure-play pet leader and a repeat #1 on ACSI’s online-retail study — its score near 85 beats Amazon on satisfaction.
Customer experience: Cult-like, in the best way. Handwritten condolence notes and surprise pet portraits show human warmth at scale — the clearest proof here that emotional connection outperforms discounts.
Innovation: Autoship subscriptions, telehealth vet services, and a pharmacy business growing faster than the core.
Support model: Large outsourced and in-house teams handling millions of contacts a year with remarkable consistency of tone.
Why it ranks here: The CX benchmark of the entire list. Chewy shows what a support-led moat looks like.
7. eBay — Score 82/100
HQ: San Jose, CA Founded: 1995 Revenue: ~$10B total; ~$75B GMV
Market position: A top marketplace by traffic, revitalized by focus on trading cards, collectibles, and authenticated luxury goods.
Customer experience: Solid marketplace satisfaction (ACSI near 81), rebuilt through authentication services for sneakers, watches, and handbags that restored buyer trust.
Innovation: AI listing tools that improve search relevance, plus verticalized authentication programs.
Support model: Tiered seller support that keeps high-volume sellers loyal and productive.
Why it ranks here: A reinvented marketplace that found defensible niches instead of fighting Amazon head-on.
8. Target — Score 81/100
HQ: Minneapolis, MN Founded: 1902 Revenue: ~$107B total
Market position: A strong omnichannel player where same-day services (Drive Up, pickup) now drive the majority of digital sales.
Customer experience: Curated assortments and exclusive private labels (Cat & Jack, Threshold) plus buzzy designer collaborations create loyalty and traffic spikes.
Innovation: Drive Up curbside became an industry standard; Roundel retail media and Target Circle deepen engagement.
Support model: Multiple BPO partnerships to hold satisfaction steady when holiday call volumes triple.
Why it ranks here: A design-led brand that turned same-day fulfillment into a competitive edge.
9. Best Buy — Score 79/100
HQ: Richfield, MN Founded: 1966 Revenue: ~$41.5B total
Market position: The rare big-box electronics survivor, defended by price-matching and Geek Squad.
Customer experience: A hybrid model where knowledgeable in-store associates support online chat creates cross-channel consistency pure-plays can’t match.
Innovation: Total Tech membership (recurring revenue), plus a strong open-box and refurbished marketplace.
Support model: Geek Squad remains a differentiator — human, expert, and monetizable.
Why it ranks here: A decade of rebuilt trust turned into a durable electronics niche.
10. Kroger — Score 78/100
HQ: Cincinnati, OH Founded: 1883 Revenue: ~$147B total
Market position: A grocery e-commerce pioneer that invested in digital before most peers took it seriously.
Customer experience: Steady satisfaction (ACSI near 76), boosted by the Boost membership, same-day delivery, and improved order accuracy.
Innovation: Automated fulfillment centers, personalized digital coupons, and data-driven loyalty via 84.51°.
Support model: BPO partnerships absorb peak grocery surges when volumes can triple in 48 hours.
Why it ranks here: The category standard-bearer for online grocery CX.
11. Lowe’s — Score 76/100
HQ: Mooresville, NC Founded: 1946 Revenue: ~$83B total
Market position: The #2 home-improvement e-commerce brand, gaining ground on Home Depot via pro-contractor tools.
Customer experience: Recent value-perception pressure from pricing (ACSI near 74), offset by app improvements and expanded same-day delivery.
Innovation: Pro Supply growth, MVPs Pro loyalty, and niche strength in outdoor power equipment and installation.
Support model: Expanded outsourced capacity to handle seasonal DIY surges.
Why it ranks here: Smart niche selection against a scale leader, with rising B2B momentum.
12. Wayfair — Score 74/100
HQ: Boston, MA Founded: 2002 Revenue: ~$11.9B total
Market position: A leading online-only furniture retailer with ~14 million items from thousands of suppliers.
Customer experience: The hard problem is buying big-ticket furniture sight-unseen; Wayfair answers it with 3D room planners and AR try-on that measurably cut returns.
Innovation: Proprietary logistics for oversized delivery and visualization tech built for the category.
Support model: Complex service workflows — delivery scheduling, white-glove assembly, damage claims — requiring longer agent training than typical retail.
Why it ranks here: Category-defining tech for a notoriously difficult e-commerce vertical.
13. Macy’s — Score 73/100
HQ: New York, NY Founded: 1858 Revenue: ~$23B total
Market position: A department-store survivor now generating roughly a third of revenue digitally.
Customer experience: Improved omnichannel (BOPIS at every store) recaptured convenience-driven shoppers; Star Rewards and Backstage drive repeat visits.
Innovation: Disciplined footprint rationalization paired with flagship-experience investment.
Support model: Seasonal scaling handles roughly triple holiday volume.
Why it ranks here: A department store that modernized instead of collapsing.
14. Nordstrom — Score 72/100
HQ: Seattle, WA Founded: 1901 Revenue: ~$15B total
Market position: The premium fashion anchor, spanning full-price and Nordstrom Rack.
Customer experience: Legendary service (ACSI near 79) and a loyalty program built on personal-stylist relationships that justify higher order values.
Innovation: Early moves in styling subscriptions and store-within-a-store concepts that create digital loyalty.
Support model: Higher per-associate investment than mass-market peers keeps satisfaction elevated at premium price points.
Why it ranks here: Service-led differentiation is the entire brand — and it works.
15. Kohl’s — Score 70/100
HQ: Menomonee Falls, WI Founded: 1962 Revenue: ~$16B total
Market position: A mid-market department store whose Amazon-returns partnership drives incremental foot traffic and digital conversion.
Customer experience: Strong ACSI showing near 79; Kohl’s Cash creates genuine repeat-visit urgency, and Sephora-at-Kohl’s revitalized beauty relevance with younger shoppers.
Innovation: The Amazon returns tie-up remains a genuinely clever traffic engine.
Support model: Sophisticated returns case management across direct orders and Amazon drop-offs.
Why it ranks here: Partnership-driven traffic and a smart beauty pivot.
16. Etsy — Score 69/100
HQ: Brooklyn, NY Founded: 2005 Revenue: ~$2.8B total; ~$12B GMS
Market position: The definitive marketplace for one-of-a-kind goods, strongly mobile-first (nearly half of GMS via app).
Customer experience: Solid satisfaction (ACSI near 79) rebuilt through expanded buyer protection and ML tools that surface trustworthy sellers.
Innovation: Balances marketplace freedom with targeted trust enforcement — a hard equilibrium at millions of shops.
Support model: Buyer-protection programs covering fraud, delays, and item-not-as-described claims.
Why it ranks here: Owns a category the giants structurally can’t replicate.
17. Gap Inc. — Score 68/100
HQ: San Francisco, CA Founded: 1969 Revenue: ~$15B total
Market position: A multi-brand apparel portfolio; Old Navy over-indexes in family apparel and Athleta competes credibly in women’s athletic wear.
Customer experience: Varies by brand — Athleta’s community-led model scores highest; Banana Republic recovered from earlier brand drift.
Innovation: Segmented, brand-specific digital and loyalty strategies under one corporate roof.
Support model: Distinct brand voices maintained across shared service infrastructure.
Why it ranks here: A case study in managing diverging customer expectations across a portfolio.
18. Williams-Sonoma — Score 66/100
HQ: San Francisco, CA Founded: 1956 Revenue: ~$7.7B total
Market position: A high-margin home retailer generating the majority of revenue direct-to-consumer.
Customer experience: Consultative, design-led selling and white-glove delivery support premium pricing; the registry business drives multi-decade relationships.
Innovation: Early adopter of digital catalogs and 3D room visualization.
Support model: Associates with culinary or design training prioritize lifetime value over transaction speed.
Why it ranks here: Proof that expertise-led service sustains premium home retail.
19. Qurate Retail (QVC & HSN) — Score 65/100
HQ: West Chester, PA Founded: 1986 Revenue: ~$10B total
Market position: The American pioneer of live shopping — decades before TikTok Shop — with a highly repeat-purchase customer base.
Customer experience: Host-driven storytelling and urgency create loyalty; direct-response infrastructure handles enormous call spikes during featured segments.
Innovation: Live commerce expertise now newly relevant as video shopping goes mainstream.
Support model: Rapid, high-volume call handling few partners can match without quality loss.
Why it ranks here: A legacy format that suddenly looks like the future again.
20. Ulta Beauty — Score 64/100
HQ: Bolingbrook, IL Founded: 1990 Revenue: ~$11.3B total
Market position: The largest U.S. beauty specialty retailer, blending mass and prestige under one roof.
Customer experience: Ultamate Rewards is among retail’s most engaged loyalty programs; online-to-salon integration deepens stickiness.
Innovation: AR try-on, AI shade matching, and personalized replenishment prompts.
Support model: Beauty-advisor expertise extended into digital chat and consultation.
Why it ranks here: Category leadership plus a loyalty engine that rivals the giants’.
21. Nike — Score 63/100
HQ: Beaverton, OR Founded: 1964 Revenue: ~$51B total; large Nike Direct/Digital mix
Market position: The leading athletic DTC brand, with digital a core pillar of its direct strategy.
Customer experience: Membership (Nike App, SNKRS) delivers personalization, early access, and community that drive repeat purchases.
Innovation: App ecosystem, connected membership, and data-driven product drops.
Support model: Membership-centric service tightly linked to the app experience.
Why it ranks here: A brand that turned DTC digital into a loyalty and data advantage.
22. Dick’s Sporting Goods — Score 62/100
HQ: Coraopolis, PA Founded: 1948 Revenue: ~$13B total
Market position: The dominant U.S. sporting-goods omnichannel retailer.
Customer experience: ScoreCard loyalty, ship-from-store, and experiential “House of Sport” formats bridge digital and physical.
Innovation: Vertical brands and in-store experiences that differentiate from Amazon.
Support model: Omnichannel service spanning online orders and in-store fulfillment.
Why it ranks here: Category leadership with a strong experiential moat.
23. Sam’s Club — Score 61/100
HQ: Bentonville, AR Founded: 1983 Revenue: ~$90B total (Walmart segment)
Market position: A leading membership warehouse with fast-growing digital and Scan & Go adoption.
Customer experience: Frictionless in-club tech (Scan & Go), strong renewal rates, and curbside pickup.
Innovation: AI-assisted exit technology and app-first shopping.
Support model: Member-first service backed by Walmart-scale infrastructure.
Why it ranks here: Membership loyalty plus genuine digital-experience innovation.
24. Albertsons — Score 60/100
HQ: Boise, ID Founded: 1939 Revenue: ~$80B total
Market position: A major grocery player with rapidly growing digital sales and a strong loyalty base.
Customer experience: For U loyalty, expanded delivery and pickup, and pharmacy integration lift engagement.
Innovation: Retail media network and automated micro-fulfillment investments.
Support model: Scaled grocery support with heavy peak-period demand.
Why it ranks here: Grocery e-commerce momentum with a loyalty backbone.
25. TJX Companies — Score 59/100
HQ: Framingham, MA Founded: 1956 Revenue: ~$56B total
Market position: The off-price giant whose treasure-hunt model is deliberately store-led, with a growing, curated online presence.
Customer experience: Value and discovery drive intense loyalty; the online store extends rather than replaces the in-store hunt.
Innovation: Disciplined buying and a model that stays resilient across economic cycles.
Support model: Lean digital support aligned to a store-first strategy.
Why it ranks here: Enormous scale and a model uniquely insulated from pure-price competition.
26. Dell Technologies — Score 58/100
HQ: Round Rock, TX Founded: 1984 Revenue: ~$88B total
Market position: A direct-sales pioneer; Dell.com remains one of the largest configure-to-order storefronts in tech.
Customer experience: Strong B2B and B2C digital purchasing, with configuration tools and account-based ordering.
Innovation: Made build-to-order mainstream decades ago; now layering AI-driven support and financing.
Support model: Extensive technical support across consumer and enterprise tiers.
Why it ranks here: The original direct-to-customer tech seller, still at massive scale.
27. Petco — Score 57/100
HQ: San Diego, CA Founded: 1965 Revenue: ~$6.5B total
Market position: A leading omnichannel pet retailer differentiating through in-store services against pure-play Chewy.
Customer experience: Vital Care membership, in-store vet clinics, and grooming tie digital to physical.
Innovation: Services-led model (health, grooming) that a pure e-commerce player can’t fully match.
Support model: Blended service across e-commerce, subscriptions, and clinical appointments.
Why it ranks here: A services moat in a category dominated by a CX heavyweight.
28. Instacart (Maplebear) — Score 56/100
HQ: San Francisco, CA Founded: 2012 Revenue: ~$3.4B total; ~$33B GTV
Market position: The largest U.S. grocery-delivery marketplace, partnering with hundreds of retailers.
Customer experience: Convenience-driven, with the classic three-sided challenge of shoppers, customers, and retailers to align.
Innovation: Fast-growing retail media (Carrot Ads) and AI-powered fulfillment and substitution.
Support model: Multi-party support handling customer, shopper, and retailer issues simultaneously.
Why it ranks here: Infrastructure powering much of grocery e-commerce, not just its own brand.
29. Carvana — Score 55/100
HQ: Tempe, AZ Founded: 2012 Revenue: ~$13.7B total
Market position: The category disruptor for online used-car buying, back on a strong growth trajectory after earlier turbulence.
Customer experience: Radical transparency — full history, no-haggle pricing, a seven-day return window — removes the friction shoppers hate most.
Innovation: Vending-machine towers, home delivery, and fully online purchase and financing.
Support model: Support built for title transfers, financing, and delivery coordination at scale.
Why it ranks here: Proof that even high-consideration, high-ticket categories can go digital-first.
30. Beyond (Overstock / Bed Bath & Beyond) — Score 53/100
HQ: Midvale, UT Founded: 1999 Revenue: ~$1.4B total
Market position: A pure-play home e-commerce brand rebuilt around the acquired Bed Bath & Beyond and Overstock names.
Customer experience: Value-led home shopping with an evolving loyalty and membership approach.
Innovation: Brand-portfolio strategy and asset-light marketplace positioning.
Support model: Digital-first service focused on home-category logistics and returns.
Why it ranks here: A storied name reinventing itself for the next chapter of home e-commerce.
Comparing the Top eCommerce Companies
Structured side-by-side, the leaders’ different strategies come into focus. (Figures are latest reported / approximate; capabilities reflect standard 2026 offerings.)
|
Company |
Est. Revenue |
Category Focus |
Mobile App |
Loyalty |
Same-Day |
|
Amazon |
~$638B |
Everything |
Best-in-class |
Prime |
Yes |
|
Walmart |
~$681B |
Grocery + GM |
Strong |
Walmart+ |
Yes |
|
Apple |
~$391B |
Electronics |
Excellent |
— |
Limited |
|
Costco |
~$254B |
Warehouse |
Improving |
Membership |
Via partners |
|
Home Depot |
~$152B |
Home improve. |
Strong |
Pro loyalty |
Yes |
|
Chewy |
~$11.9B |
Pet |
Strong |
Autoship |
Regional |
|
Target |
~$107B |
General merch |
Strong |
Target Circle |
Yes (Drive Up) |
|
Best Buy |
~$41.5B |
Electronics |
Strong |
Total Tech |
Yes |
|
Kroger |
~$147B |
Grocery |
Strong |
Boost |
Yes |
|
Wayfair |
~$11.9B |
Furniture |
Good |
Rewards |
Regional |
A few things jump out. Revenue and CX don’t move together — Chewy, a fraction of the giants’ size, out-satisfies nearly all of them. Membership is nearly universal among the leaders. And same-day fulfillment has shifted from differentiator to expectation at the top of the market.
What the Best eCommerce Companies Have in Common
Step back from the individual profiles and clear patterns emerge across the winners:
- Fast, flexible fulfillment — Same-day, next-day, curbside, and pickup are standard among the leaders. Speed is an expectation, not a perk.
- True omnichannel — The best brands erase the seam between online, app, and store — one cart, one loyalty account, one experience.
- AI-powered service and personalization — Winners use AI to personalize discovery, forecast demand, and deflect routine contacts so humans handle complex issues.
- Effortless returns — Generous, frictionless return policies build the trust that drives repeat purchase.
- Self-service that works — Order tracking, easy reorders, and robust help centers reduce contacts while raising satisfaction.
- Loyalty and membership — Prime, Walmart+, Boost, Ultamate, Autoship — recurring programs turn transactions into relationships.
- Proactive communication — Leaders flag delays, shipping, and issues before the customer has to ask.
- CX as strategy, not cost — The through-line of the whole list: winners treat service as revenue protection, not a budget line to minimize.
Customer Experience Trends Shaping eCommerce
- AI chatbots and human support, together — The winning pattern isn’t bots replacing agents; it’s AI handling routine queries so skilled humans focus on complex, emotional, high-value interactions.
- Voice support, reinvented — Voice AI triages and resolves simple calls while live agents handle escalations — cutting wait times without losing the human touch.
- Live chat is now expected — Real-time chat has become the default for pre-purchase questions and quick support, lifting conversion when staffed well.
- True omnichannel service — Customers expect to start on chat, continue by email, and finish by phone without repeating themselves. Context must follow them.
- Social commerce and social service — As shopping moves onto Instagram, TikTok, and WhatsApp, service follows — comments, DMs, and reviews are front-line support.
- Mobile-first everything — With smartphones driving most transactions, mobile app quality is among the highest-rated CX factors — and a top reason customers switch.
- Personalization at scale — Shoppers expect service and recommendations tailored to their history; generic support now reads as a red flag.
- Retention over acquisition — As acquisition costs climb, leaders pour resources into post-purchase experience, because keeping a customer beats winning a new one.
The Operational Challenges Behind Great CX
Delivering that experience is genuinely hard. The operational realities every scaling e-commerce brand runs into:
- Seasonal spikes — Black Friday, Cyber Monday, and the holidays can triple or quadruple contact volume in days.
- High return volumes — online return rates dwarf in-store, generating heavy tracking, refund, and claims load.
- Order-tracking inquiries — “where is my order?” is the most common contact type, and the most automatable.
- Cart-abandonment recovery — roughly seven in ten carts are abandoned; proactive outreach recovers real revenue.
- Marketplace and seller support — Amazon, eBay, and Etsy sellers need specialized workflows distinct from direct retail.
- Multilingual customer service — a U.S. base increasingly expects English and Spanish support, and often more.
- 24/7 availability — online shopping never sleeps, which strains single-region, in-house teams.
- Scaling operations — growing headcount fast without diluting quality or brand voice is the hardest problem of all.
- Workforce management — forecasting, scheduling, training, and QA across fluctuating volume is a discipline unto itself.
How Leading Brands Scale Customer Support
Here’s the part most rankings skip: how the top e-commerce companies actually deliver CX at scale. Nearly every leader in the top 10 invests heavily in support infrastructure — and the smartest blend approaches rather than choosing one.
In-house vs. outsourced: Wages rose, training expanded, and expectations climbed faster than internal teams could scale. The leading pattern is hybrid — keep core, brand-defining relationships in-house, and partner with specialists for peak overflow, after-hours, and multilingual coverage. Outsourcing has shifted from a cost play to a strategic capability.
Nearshore customer service: For U.S. brands, nearshore support from Latin America is the sweet spot: native or near-native bilingual (English/Spanish) agents, real-time U.S. time-zone alignment, and cultural affinity with American shoppers — at a fraction of onshore cost, without the friction of far-offshore models.
Live chat and voice operations: Scaling real-time channels demands disciplined workforce management — forecasting volume, staffing to it, and holding quality across every agent.
Back-office and order management: Data entry, order processing, and workflow tasks can move off the critical path, freeing internal teams for higher-value work.
Returns and claims processing: Given how much contact volume is returns-driven, specialized handling directly protects both CSAT and margin.
Seasonal staffing: The ability to absorb 3–5x peak spikes and scale back down is why leaders lean on flexible partners instead of over-hiring year-round.
Bilingual support: Serving a growing Hispanic consumer base in-language is now a measurable driver of satisfaction and loyalty.
When brands evaluate a support partner, three capabilities separate the strong from the disappointing: demonstrable expertise in their vertical; infrastructure that scales gracefully through peak; and quality assurance that holds a consistent brand voice across every agent and channel. Miss any one, and the partnership frays.
| The SkyCom model
This is precisely what SkyCom is built for — bilingual, nearshore, omnichannel customer support that scales with demand, delivered from modern LATAM centers in real-time U.S. time-zone alignment, at 50–70% below onshore cost. For retail and e-commerce brands feeling the operational strain above, it’s the difference between experience that erodes under pressure and experience that becomes a competitive weapon. |
Conclusion
The companies leading U.S. e-commerce in 2026 aren’t at the top because they’re the largest — they’re there because they consistently deliver outstanding customer experiences. Amazon set the standard by obsessing over customers before it was fashionable. Chewy out-satisfies giants many times its size through genuine human warmth at scale. Walmart pairs enormous reach with real, measurable CX gains. And every other brand here carved out its position through deliberate experience choices, not scale alone.
As consumer expectations keep rising, three advantages will decide the next decade: scalable support that flexes with demand, omnichannel engagement that meets customers wherever they are, and operational efficiency that protects margin while protecting the experience. The retailers who treat customer service as a competitive weapon — not a cost to minimize — will compound their lead. The ones who don’t will watch loyalty quietly walk out the door.
Planning your retail or e-commerce CX strategy for the next peak season? SkyCom delivers bilingual, nearshore customer support built to scale — inbound, chat, email, social, returns, and back-office — from LATAM, in your time zone, at 50–70% lower cost.